Marcelle Chauvet*
(Updated November 8—see Figures 1–3 and text in bold)
The National Bureau of Economic Research (NBER) Business Cycle Dating Committee has been dating the U.S. expansions and recessions for the past 60 years. The members of the committee reach a subjective consensus about business cycle turning points, and this decision is generally accepted as the official dating of the U.S. business cycle.
Although careful deliberations are applied to determine turning points, the NBER procedure cannot be used to monitor business cycles on a current basis. Generally, the committee meets months after a turning point (that is, the beginning or end of an economic recession) has occurred and releases a decision only when there is no doubt regarding the dating. This certainty can be achieved only by examining a substantial amount of ex post revised data. Thus, the NBER dating procedure cannot be used in real time. For example, the NBER announced only in July 2003, 20 months after the fact, that the 2001 recession had ended in November 2001.
Some models, however, can gauge how weak or strong the economy is and date business cycles in real time.
Formal probability models for dating recessions
In recent decades, analytical models that formalize the construction of economic indicators and probabilistic frameworks that define and evaluate turning point forecasts have gained popularity. In particular, the dynamic factor Markov switching (DFMS) model in Chauvet (1998) has been very successful in dating business cycles in real time and in closely reproducing the NBER dating.
The model yields a monthly indicator of the U.S. business cycles and probabilities of recessions and expansions when applied to the same series used by the NBER: nonagricultural employment, real personal income, real manufacturing and trade sales, and industrial production. The estimated probabilities can be used to obtain dates for the U.S. business cycle and to assess the state of the economy. The resulting chronology is highly correlated with the NBER dating ex post and in real time. Thus, this formal analytical model can be used to monitor turning points and evaluate the strength or weakness of the economy in real time, overcoming the delays of the NBER dating procedure.
What does the DFMS nonlinear probability model tell us about U.S. recessions?
Since 1959 the U.S. economy has experienced eight recessions. Figure 1 shows the business cycle indicator, and figure 2 shows the smoothed probabilities of recessions obtained from the DFMS model and the NBER recession dating. The probabilities are obtained using full sample information (that is, all information available from 1959 up to now).
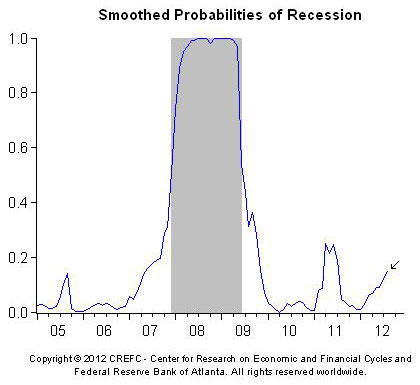
As figure 2 illustrates, the probabilities increase substantially at the beginning of recessions (peaks) and decrease around the end of the recessions (troughs). Recessions are generally short, lasting on average a year, whereas expansions are much longer, averaging about five years. The 1990s experienced the longest U.S. expansion (ten years) in the past 150 years, while the 2007–9 recession was the longest in the past 50 years. (Figure 3 uses the same data as figure 2 but focuses on the period since 2005.)
Figure 1. Smoothed probabilities of recessions from the dynamic factor model with regime switching and NBER recessions (shaded areas)
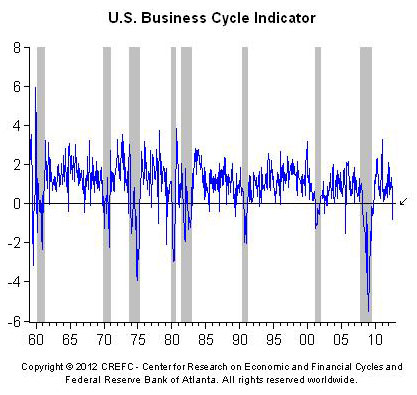
Figure 2. Business cycle indicator from the dynamic factor model with regime switching and NBER recessions (shaded areas)
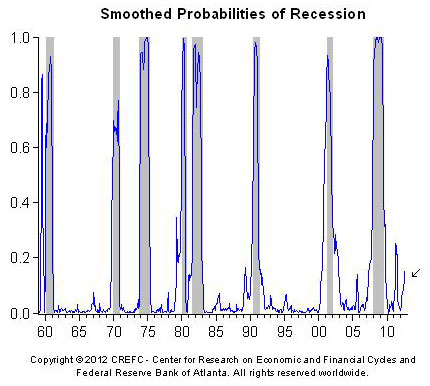
Figure 3. Smoothed probabilities of recessions since 2005 from the dynamic factor model with regime switching and NBER recession (shaded area)
Current probability of recession
Because of a two-month delay in the availability of the manufacturing and trade sales series, the probabilities of recession are also available only with a two-month delay. The Center for Research on Economic and Financial Cycles provides a calendar of release dates (conditional on the availability of data) for the probabilities of recession and the business cycle indicator.
The most recent probability of recession from the DFMS model is for August 2012, which uses information available as of the end of October 2012. The probability that the U.S. economy was in a recession in August 2012, using information as of the end of October 2012, is 15.2 percent. (Equivalently, the model shows an 84.8 percent probability that the economy was in an expansion in August 2012.)
For more information, see "Real-Time Probabilities of Recessions" and "The Beginning and End of the 2007–2009 Recession."
*Marcelle Chauvet is a professor of economics at the University of California, Riverside, and research director of the Center for Research on Economic and Financial Cycles.
References
Chauvet, Marcelle. 1998. An econometric characterization of business cycle dynamics with factor structure and regime switching. International Economic Review 39, no. 4:969–96.
Chauvet, Marcelle, and James Hamilton. 2006. Dating business cycle turning points. In Nonlinear time series analysis of business cycles, edited by Costas Milas, Philip Rothman, and Dick van Dijk. Amsterdam: Elsevier Science Publishing.